Data captured by ideology:Examining a new report on Antisemitism in Victoria
The Victorian Jewish Community Security Group (CSG) 2024 Victorian Antisemitism Report
I spent some today, aided by AI, examining the new Victorian Jewish Community Security Group (CSG) 2024 Victorian Antisemitism Report. As part of this, I read and interrogated the textual contents and I converted the pdf tables of incidents in the report into Excel spreadsheets for analytical purposes.As deeper background, I used other research, including analyses of like and unlike reports and various analytical frameworks that have resulted in 18 variables that can be used to investigate the quality of such reports. Only the AI augmentation device can do that and this has allowed me to interrogate the data more closely and at a speed than would otherwise not be possible. AI can be useful, if used carefully.1
The CSG report also discusses other events such as the incidence of campus antisemitism, but I will leave that for another time because there are also serious methodological issues that limit the utility of that campus-focused research.
I keep the remarks here relatively general, as a full analysis would be considerably longer and take a few days (sorry!) I have don’t have much to say about the reporting of Nazi and related traditional antisemitic hate by CSG. We need this sort of data for obvious reasons. Clear hate against Jews, is on the increase and Gaza or not, it is unacceptable. And I’m sure that some of the perpetrators couldn’t give a damn about Gazans, but just hate Jews. Enough said on that front.
That element of the report is broadly clear and aligns with widely understood definitions of antisemitism.
What’s the problem?
The difficulty arises when the CSG report moves beyond this domain and makes broader claims, particularly in relation to Israel/Palestine and the attribution of incidents to the “far left.” Its data is drawn from incidents reported from a variety of sources across Melbourne and into other parts of the state. Since numbers of incidents of the sort being discussed here outside of a few municipalities, the discussion below only concerns areas Port Phillip, Glen Eira or Stonnington (where most Jews live) and “Northside” municipalities, where there is a lot of left activity.
Whereas prior to October 7, antisemitism related to Israel-Palestine accounted for just 8% of incidents, in 2024 this had ballooned to 59% of all incidents. The 325 antisemitic incidents which explicitly referenced Israel, Zionism or Palestine in 2024 represents a 1,377% like-for-like increase on 2022, illustrating that antisemitic rhetoric has shifted since October 7, 2023. Antisemitism linked to Israel Palestine is now the dominant form of anti-Jewish hate in Victoria. This report does not consider criticism of Israel to be antisemitic.
How to interpret this claim? A diagram helps.
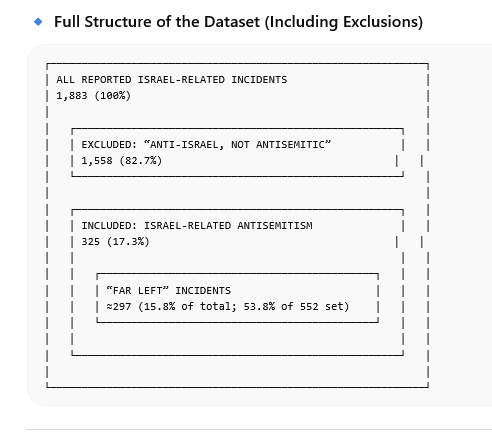
Seeing incidents via this set of boxes, the claims look very different: the “far left” category sits inside a relatively small subset of incidents that have already been selected from a much larger pool through an unseen classification process.
Outer box (1,883 100%) → all Israel/Jews-related incidents reported
Excluded (1,558 / 82.7%)→ the majority, classified as not antisemitic
Included (325 / 17.3%) → those counted as antisemitic
“Far left” (~297 53.8 %)→ a subset of that Included group.
At first glance the claim “Antisemitism linked to Israel Palestine is now the dominant form of anti-Jewish hate in Victoria” is striking. But this claim has to be unpacked. In fact, the CSG/JCCV report represents an ideological shift in the interpretation of reported antisemitic incident data. The 2023 report provides a useful baseline in this regard: it identified incidents across a range of ideological sources ( roughly Islamist, far right, left etc). but avoided strong claims of dominance or causal transformation. By contrast, the 2024 report advances a much more assertive position—that “far-left antisemitism” is both predominant and a key driver of the overall increase in incidents. The “far left” is, in effect, positioned as the central explanatory category2.
Undefined Left Bashing
But the term “far left” itself, is never clearly defined in operational terms, though it is associated with hate, as in the quote above . But it remains unclear whether “far left” refers to identifiable individuals, organised groups, loosely affiliated protest participants, or broader political environments. Is it Green Left, members of the Greens, ALP Left Faction, various shadowy anarchic groups? Nothing is made clear. No criteria are provided for assigning ideological affiliation/hatred—whether based on self-identification, organisational links, expressed beliefs, or contextual inference. In practice, classification appears to be inferred from context—particularly participation in Israel/Palestine-related forms of discourse—rather than based on verifiable indicators.
This creates a risk of category inflation, where diverse phenomena are aggregated under a single label, and definitional drift, where the meaning of the category expands across stages of analysis. It also reinforces the possibility of perception drift, whereby incidents occurring within a protest setting are taken to characterize the setting itself and this then gets political and media amplification. We can’t mind read the intention of all protesters, particularly at very large events where a wide range of protesters are likely to be present. Thus, if one person holds up an ISIS or flag and another holds a poster of the (now dead) Supreme Leader Ali Khamenei, as happened on the Sydney Harbour Bridge march, is it possible to claim that all there were associated with extreme hatred? Yet that is what happens. Contrast that with a renegade preacher clearly preaching hate in a prayer hall. The key analytical boundary—between political expression and antisemitism and hatred in different—is has to be judged carefully. Context is everything. At times, it can be opaque, as certainly occurs with certain slogans that while clearly offensive to many, or potentially incitement and politically stupid, are not necessarily antisemitic (I include here Death to Israel, Intifadah Revolution, From the River to the Sea). And as a side note, there is no reference to current Australian legal rulings on hate/political speech in the CSG report. That should be relevant to any future coding activity by any Australian Jewish organisation.
So what are the incidents within the framework they propose? Unpacking the 325 incidents, I came up with:
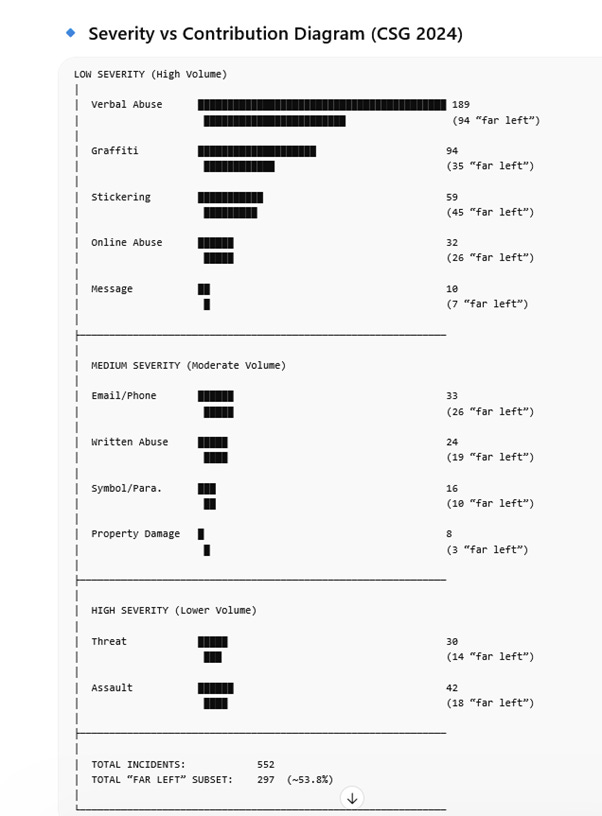
This diagram shows that most incidents are low-severity* but high-volume, such as verbal abuse, graffiti, and stickering—and these categories account for the largest share of incidents overall. It also shows that the “far left” subset is heavily concentrated within these same categories, rather than in higher-severity incidents like assault or threats. In other words, the apparent predominance of “far-left antisemitism” is driven mainly by how large numbers of lower-level, more interpretive incidents are classified.
* The category of ‘verbal abuse’ is not explained in the report as to what precisely is meant3. Of course verbal violence is a very serious matter but given the considerable controversy over what constitutes political discussion versus antisemitism, there is a possibility that because of the use of IHRA (International Holocaust Alliance) and coding ‘culture’, some of what is claimed as verbal abuse has been in fact been strong, even offensive and distressing, but not necessarily antisemitic protest language. It may not in fact be “politically” severe, distressing as it can be. The issue is highly interpretative, and recent court decisions in Australia underscore this point. Thus for both the Jerusalem Declaration (JDA) or the Nexus Document (JD), strong, even insulting and stupid language isn’t always necessarily antisemitic, however upsetting the political message is.
But this is only part of the story. The report has excluded 1,558 incidents, because they don’t meet the antisemitism threshold. But we are never told what the threshold is. As stated above, we don’t have an explanation of their coding methodology and/or lexicon of acceptable/non-acceptable discourse. In fact, AI was great at prompting me to ask logically - what did the excluded 1,558 likely contain?
There is a clue - once you look at the structure of the included dataset—dominated by verbal abuse, graffiti, stickering, and other low-level, often Israel-related expression—and combine that with the report’s own claim that it excludes “anti-Israel but not antisemitic” material, the shape of the excluded set becomes unavoidable. The excluded reported incidents must consist largely of protest slogans, political criticism of Israel, online discourse, and a significant number of borderline or ambiguous cases where interpretation is doing the work. But this is where the real issue lies: the split between the 1,558 excluded and the 325 included implicitly encodes a decision rule about what counts as antisemitism—and that rule is never made explicit. It is hidden in the classification process itself. The implications are significant. The report’s headline findings do not simply reflect behaviour in the world; they reflect how that hidden rule has been applied. AI came up with this wisdom: AI came up with this wisdom: Change the rule, even slightly, and the composition of the dataset—and therefore the conclusions about “far-left antisemitism”—could look very different.
In fact, the report defines antisemitism through a set of criteria that include anti-Jewish hatred, intimidation of individuals perceived as Jewish, support for extremist ideologies targeting Jews, the use of Holocaust or Nazi comparisons in relation to Israel or Zionism, and anti-Israel hostility directed at Jewish individuals or institutions solely because they are Jewish. All this is based on the IHRA and examples) . IHRA is being used prescriptively if these narrow terms are followed. The interpretive and coding process is nowhere outlined in the report, and what language is in or out. Which leads to a problem. Is calling Israel an apartheid state or genocidal interpreted under one of the above categories. That is really a problem because apartheid and genocide are words that are now very in the public sphere and apartheid (hafradah in Hebrew) has been current in Israel itself for a long time.
Thus some of the examples coded as “far left” are likely to have fallen under the contested categories of IHRA. Yet while IHRA provides a broad conceptual framework, was is not intended as a formal coding instrument and contains contested examples in relation to Israel. As I said the report does not explain how IHRA was operationalised in practice, nor how ambiguity is resolved. Classification therefore appears to rely significantly on subjective judgement, especially in cases involving political speech or symbolic expression. We don’t see a decision-making tree or coding lexicono for types of acceptable/non-acceptable language.
The composition of the dataset further amplifies these concerns. The majority of incidents fall into low-severity categories, such as verbal abuse, graffiti, stickers and online messaging. These categories account for a substantial proportion of all incidents and are also those most sensitive to definitional interpretation.
The heat map analysis based on using the IHRA interpretation of antisemitism demonstrates that these forms of conduct are included under IHRA-based interpretations according to its use by the CSG. Under the JDA or Nexus they would be treated as low to moderate depending on the content and context.
By contrast, high-severity incidents—such as threats and assaults—are more consistently classified across frameworks and are less dependent on interpretation and no definition would have problem with these (or arson, or other dreadful violence).
What I have also done is map this onto the location of incidents. This pattern. is made clear in the following image. In terms of where Melbourne’s Jews live and where the “left” appears to be strongest, the findings are interesting. I suggest that the numbers in Melbourne largely related to protest-related incidents, but in fact, the actual raw data and interpretive process are critical to go any further here. Because numbers are low I have left out other parts of Melbourne and the state.
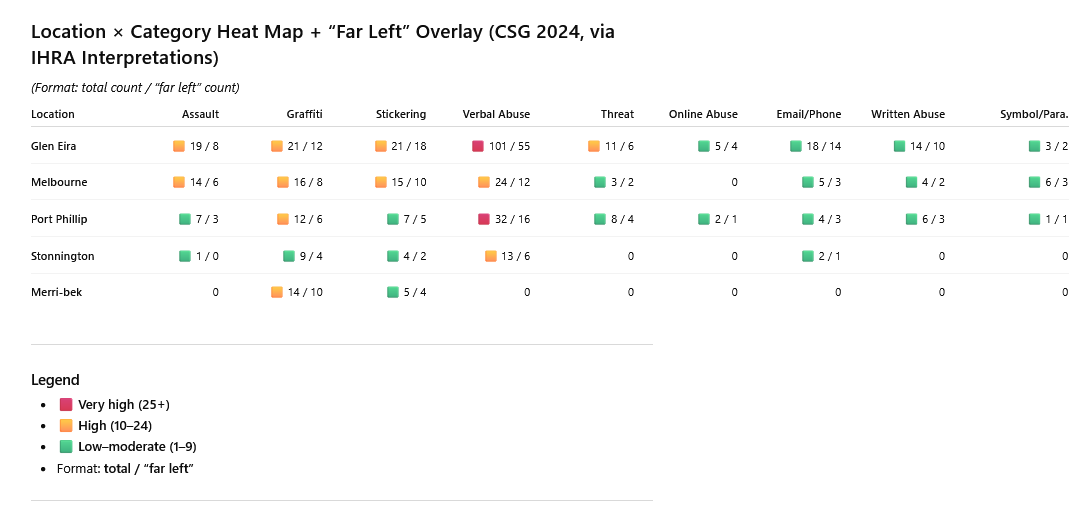
This combined heat map provides a detailed view of how incident type, location, and ideological classification (“as far left” by the CSG) intersect within the dataset. It makes visible not only where incidents occur, but also how the “far left” designation is distributed across different categories and spatial contexts.
1. Structural concentration in low-severity categories
The most immediate pattern is that the “far left” subset is overwhelmingly concentrated in low-severity (as compared to assault), high-frequency categories, particularly:
verbal abuse
graffiti
stickering
These categories dominate the dataset numerically and also account for the largest share of “far left” incidents. For example, in Glen Eira, the largest single category—verbal abuse (101)—contains a substantial “far left” subset (55). Similarly, stickers and graffiti show both high totals and high proportions of “far left” classification. This indicates that the overall prominence of “far left antisemitism” is driven primarily by expression-based incidents, which are inherently more sensitive to interpretation. But being entirely subjective here, I’m asking readers out there, how active is the “far left” in Glen Eira? Does that help with properly classifying events?
2. Geographic concentration and amplification effects
The distribution is also highly spatially concentrated, with Glen Eira acting as a dominant node across nearly all categories. This concentration is not simply a matter of higher incident counts; it also amplifies the “far left” classification because large volumes of definition-sensitive incidents are clustered in a single location. Secondary clusters in Melbourne and Port Phillip show similar but less pronounced patterns.
This creates what can be described as a local amplification effect: where high-density reporting environments intersect with broad definitional thresholds, producing a disproportionate influence on overall findings. In this sense, the dataset reflects not just incident occurrence but also reporting intensity and contextual dynamics within specific urban areas.
3. Category-specific clustering (Merri-bek case)
Merri-bek provides an important contrast. Unlike Glen Eira, it does not exhibit a broad distribution across categories but is instead concentrated almost entirely in graffiti and stickering. Within these categories, however, the proportion of “far left” incidents is high. This reinforces the point that certain locations are associated with specific types of incidents, rather than generalised antisemitic activity.
This pattern is analytically significant because it demonstrates that the “far left” classification is not uniformly distributed even within locations, but is tied to particular forms of expression that are more likely to be captured under the applied definitional framework.
4. High-severity categories remain secondary
By contrast, higher-severity categories such as assault and threat are:
smaller in total volume
less dominant in the “far left” subset
Although “far left” incidents are present in these categories, they do not drive the overall distribution. This reinforces the broader finding that the headline result is not anchored in the most serious or unambiguous forms of antisemitic harm, but in lower-level incidents where classification is more interpretive.
5. Implications for interpretation
Taken together, these patterns support a key conclusion: the “far left” finding is structurally embedded in the composition of the dataset and how data has been classified, rather than emerging evenly across incident types or locations. It reflects the interaction of three factors:
concentration in low-severity, high-volume categories
geographic clustering in specific LGAs
reliance on interpretive classification, particularly in Israel/Palestine-related contexts
In RC terms, this raises clear risks of category inflation and definitional drift, as a large number of heterogeneous incidents are aggregated under a single ideological label.
The report’s headline finding—that approximately 53.4% of incidents are attributable to the “far left”—must be understood in light of this distribution. The “far left” classification is heavily concentrated in these low-severity, high-volume categories where language interpretation and context are always issues. This indicates that the “far left” finding by the CSG is driven less by a broad pattern across all forms of antisemitic behaviour and more by how particular types of incidents are defined and classified.
The treatment of “far-right” incidents in the report also highlights an important asymmetry. Far-right antisemitism is typically identified through explicit symbols and language—such as Nazi imagery—which are stable across definitional frameworks (IHRA, JDA, Nexus). By contrast, “far-left” antisemitism is often inferred from context and association, making it more interpretive and less stable as a category.
Finally, the report introduces implicit causal claims, most notably the assertion that “far-left antisemitism” was the “driving force” behind the increase in incidents. However, the analysis remains descriptive and does not provide a causal framework, test alternative explanations, or distinguish between increases in behaviour and increases in reporting or classification. Given that the “far left” category is itself a product of the classification process, positioning it as a causal driver risks circular reasoning. The causal flaw also links into the issue of inflated political and media amplification.
Taken together, these findings suggest that the prominence of “far-left antisemitism” in the 2024 report is best understood as a framework-dependent outcome, shaped by definitional choices, classification practices, and interpretive judgement, rather than as a stable empirical measure of ideological prevalence. And the political and media amplification of not-quite-right analysis has profound effects.
In terms of the Royal Commission on Antisemitism, it is an example of how carefully community-based data needs to be considered. On the one hand, few of us would have issues with the classification of far-right data. On the other hand, the assumptions behind the “far left” data are very problematic with the particular orientation of the CSG and the assumptions it is using to conduct its work.
AI tools were used to assist with drafting and editing; however, the analytical framework, interpretation, and conclusions are the author’s own. Estimated contribution: 75–85% author, 15–25% AI assistance.
“Islamist” (undefined) is labelled for just 2.5% of incidents, Nazis for 20%, and 25% for unknown. There is no time at the moment for commentary on the unknown and Islamist attributions, but it is interesting. I think it fair to say that when there is Islamist hate and it is reported, it is consequential at a community and political level.
Quoting the definition from University of Adelaide “Verbal abuse is considered unacceptable at universities whenever it creates an intimidating, hostile, offensive, or distressing environment, violates student or staff codes of conduct, or constitutes bullying, harassment, or unlawful discrimination. Such behavior is never considered an acceptable part of the academic, work, or social culture”